Article
Descriptive Analysis
Create a descriptive analysis easily and conveniently
Create a descriptive analysis
You can create a descriptive analysis in two ways. The first is through the menu bar and the second is by dragging the column you want to analyze to the analysis panel.
Menu Bar
- Click on "Create Analysis"
- Then click on "Create Descriptive Statistics"
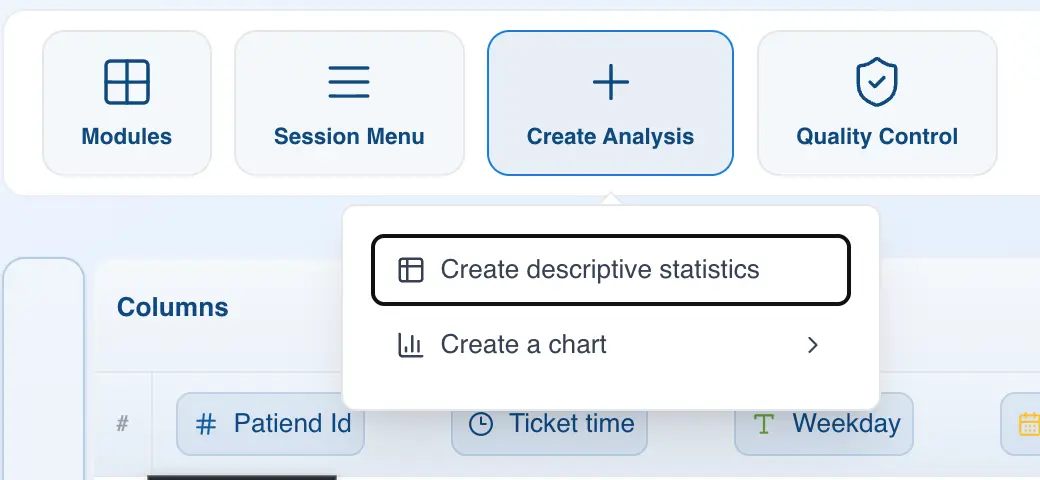
A new analysis will appear in the right panel.
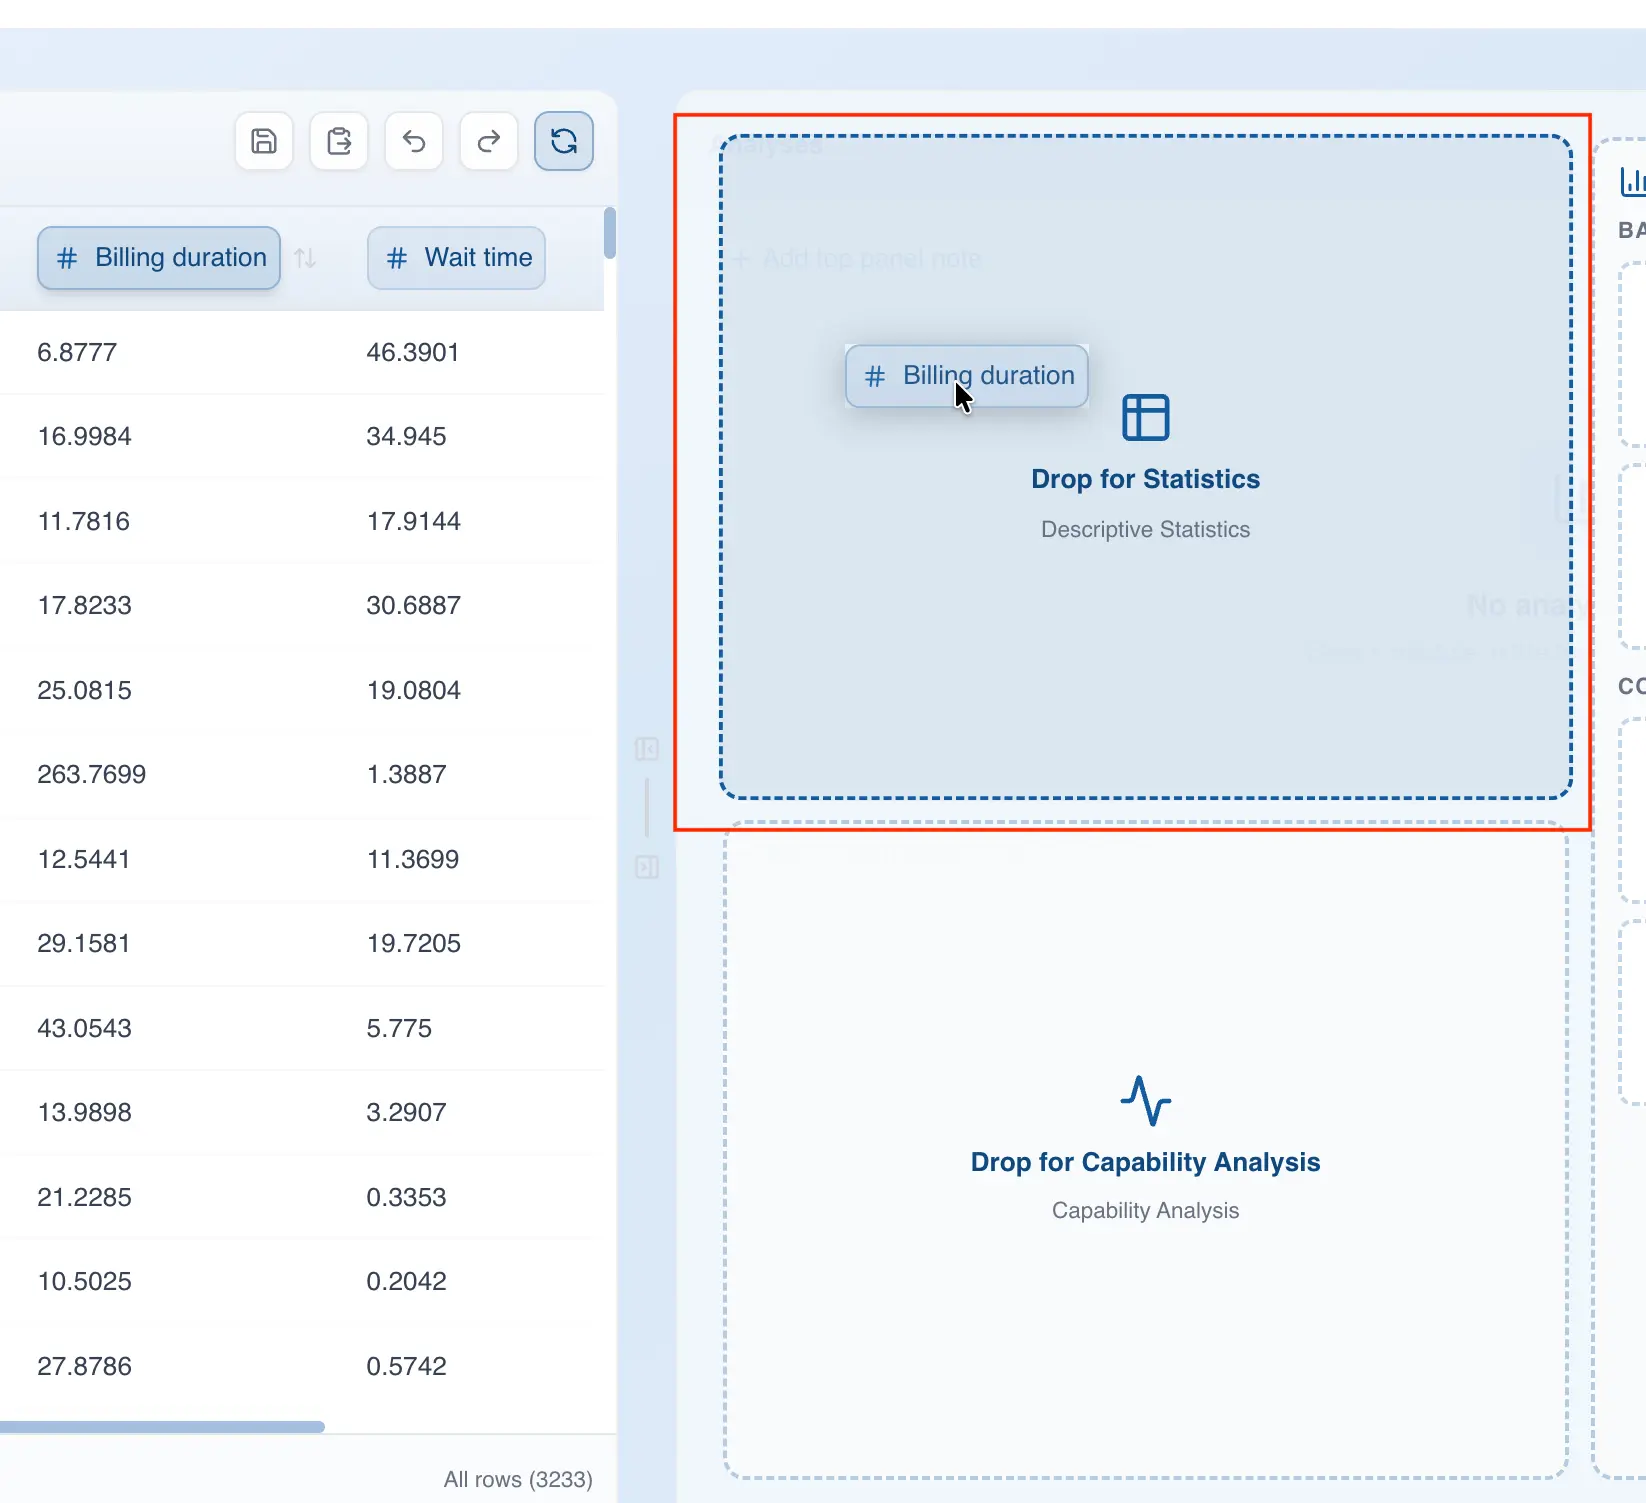
Drag and Drop
- Drag the column you want to analyze to the analysis panel
- Drop the column in the area labeled "Drop for Statistics"
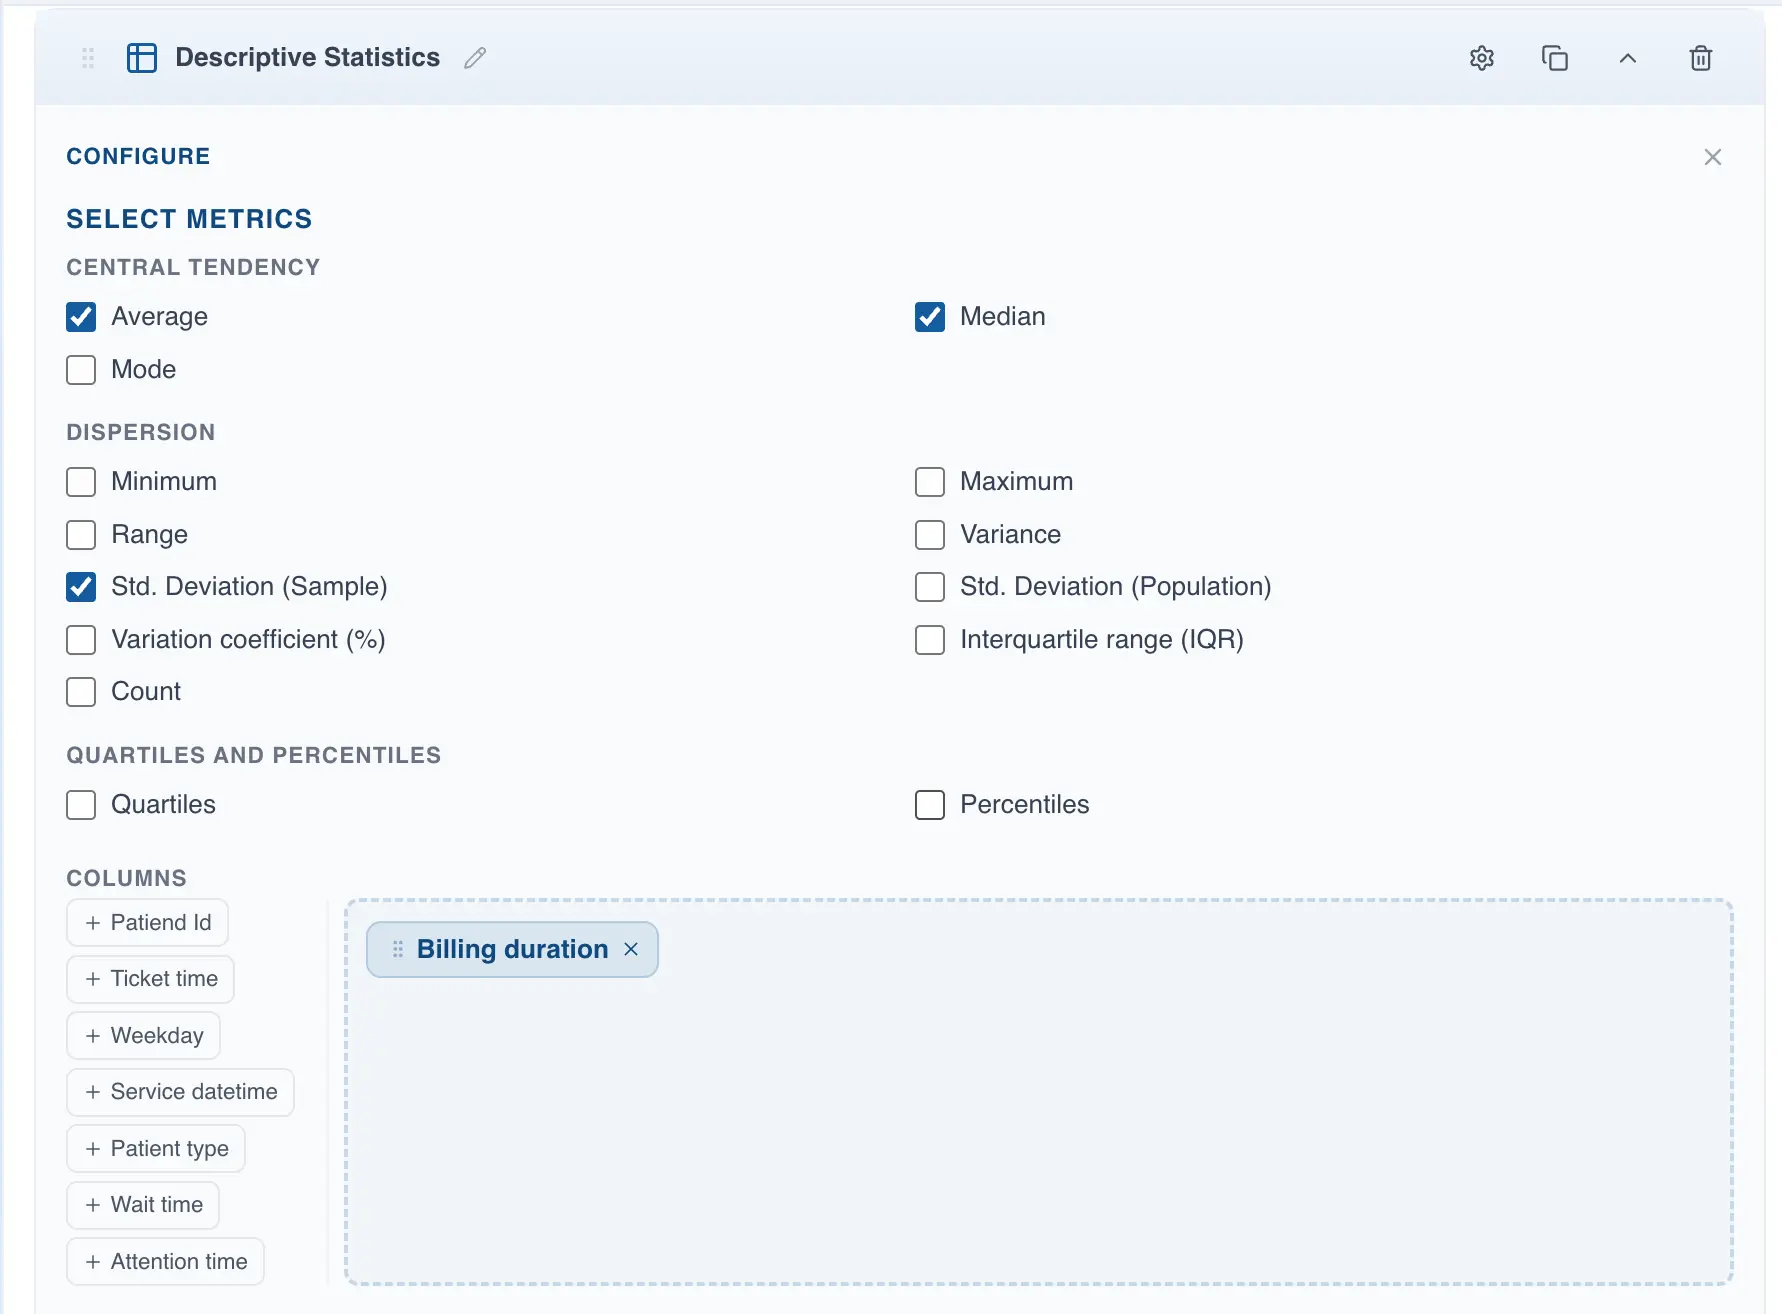
Configure the descriptive analysis
Metric selection
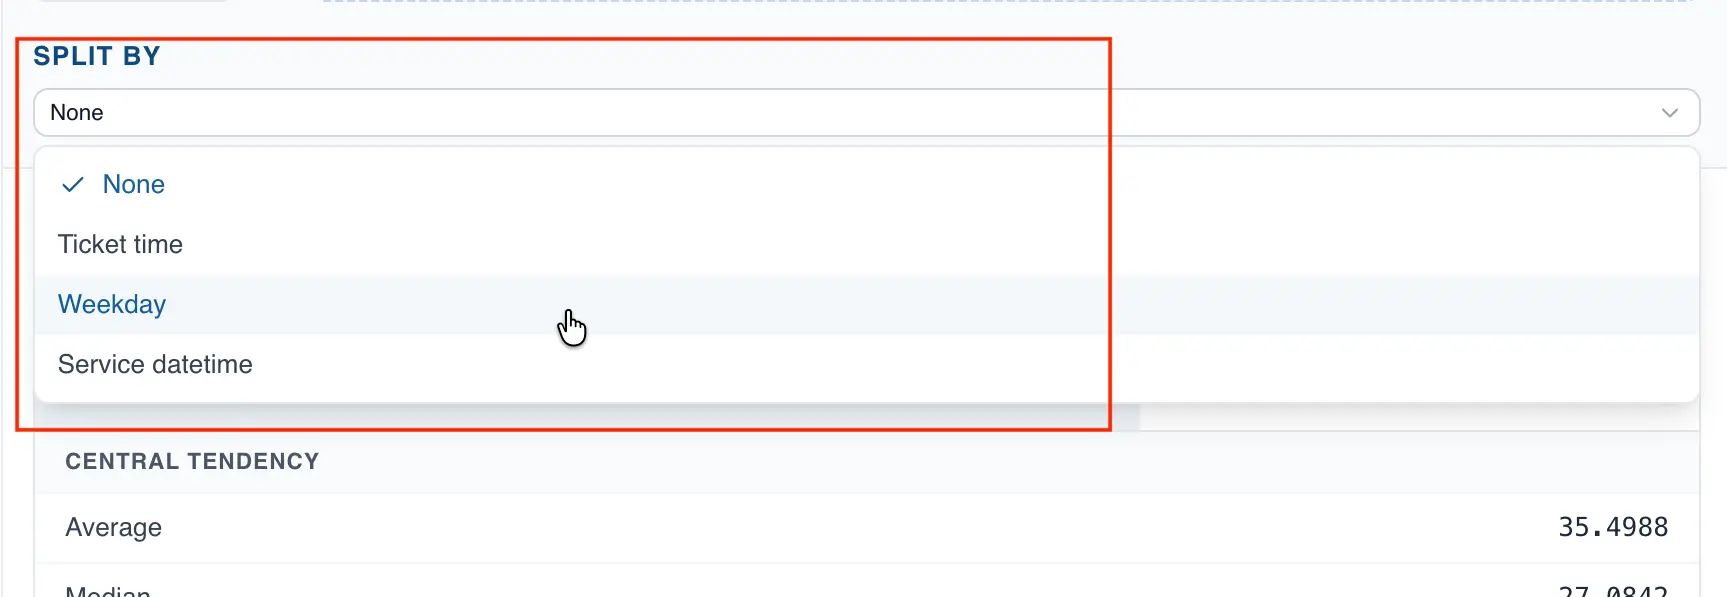
Once the analysis is created, you can configure it by clicking on the metrics you want to display. There are three metric categories:
- Measures of Central Tendency: this section includes the mean, mode, and median
- Dispersion: this group contains the range, variance, standard deviation, coefficient of variation, and interquartile range
- Quartiles and Percentiles: this section includes quartiles and percentiles
- Frequency: this section contains the count and percentages, useful for categorical data analysis
Data stratification
With QSuite you can stratify data easily, allowing you to uncover hidden patterns. Go to the "Split by" section and drag the variable you want to use for stratification.
You can stratify your data using up to two categorical variables. The first variable will be displayed as columns and the second variable as rows. For example, the following configuration contains two columns: one with date data and one categorical:
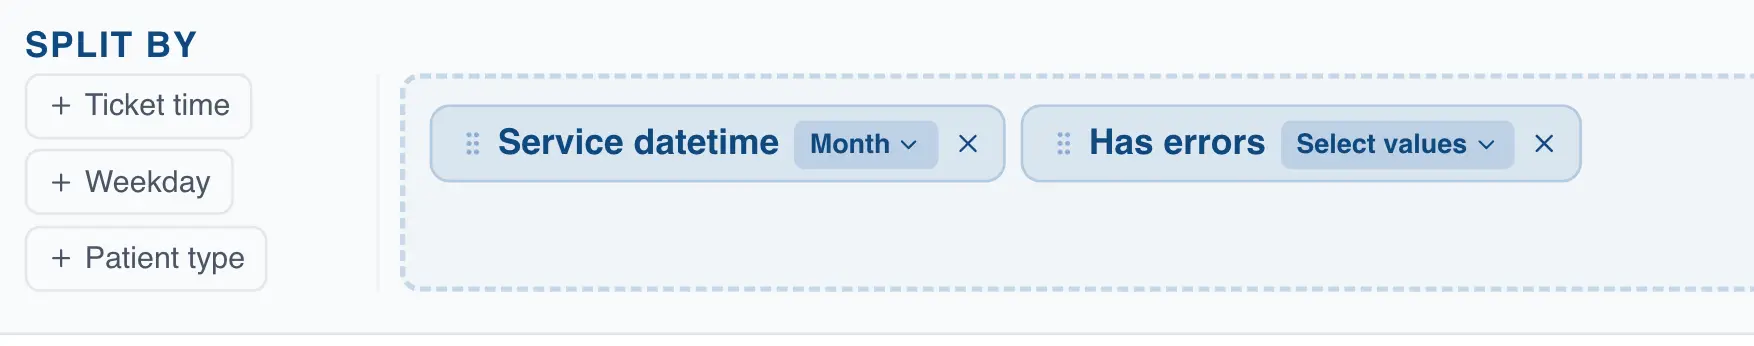
This configuration will display the date variable as columns (months of the year) and the error variable as rows (Yes, No).
Analyzing more than one data column
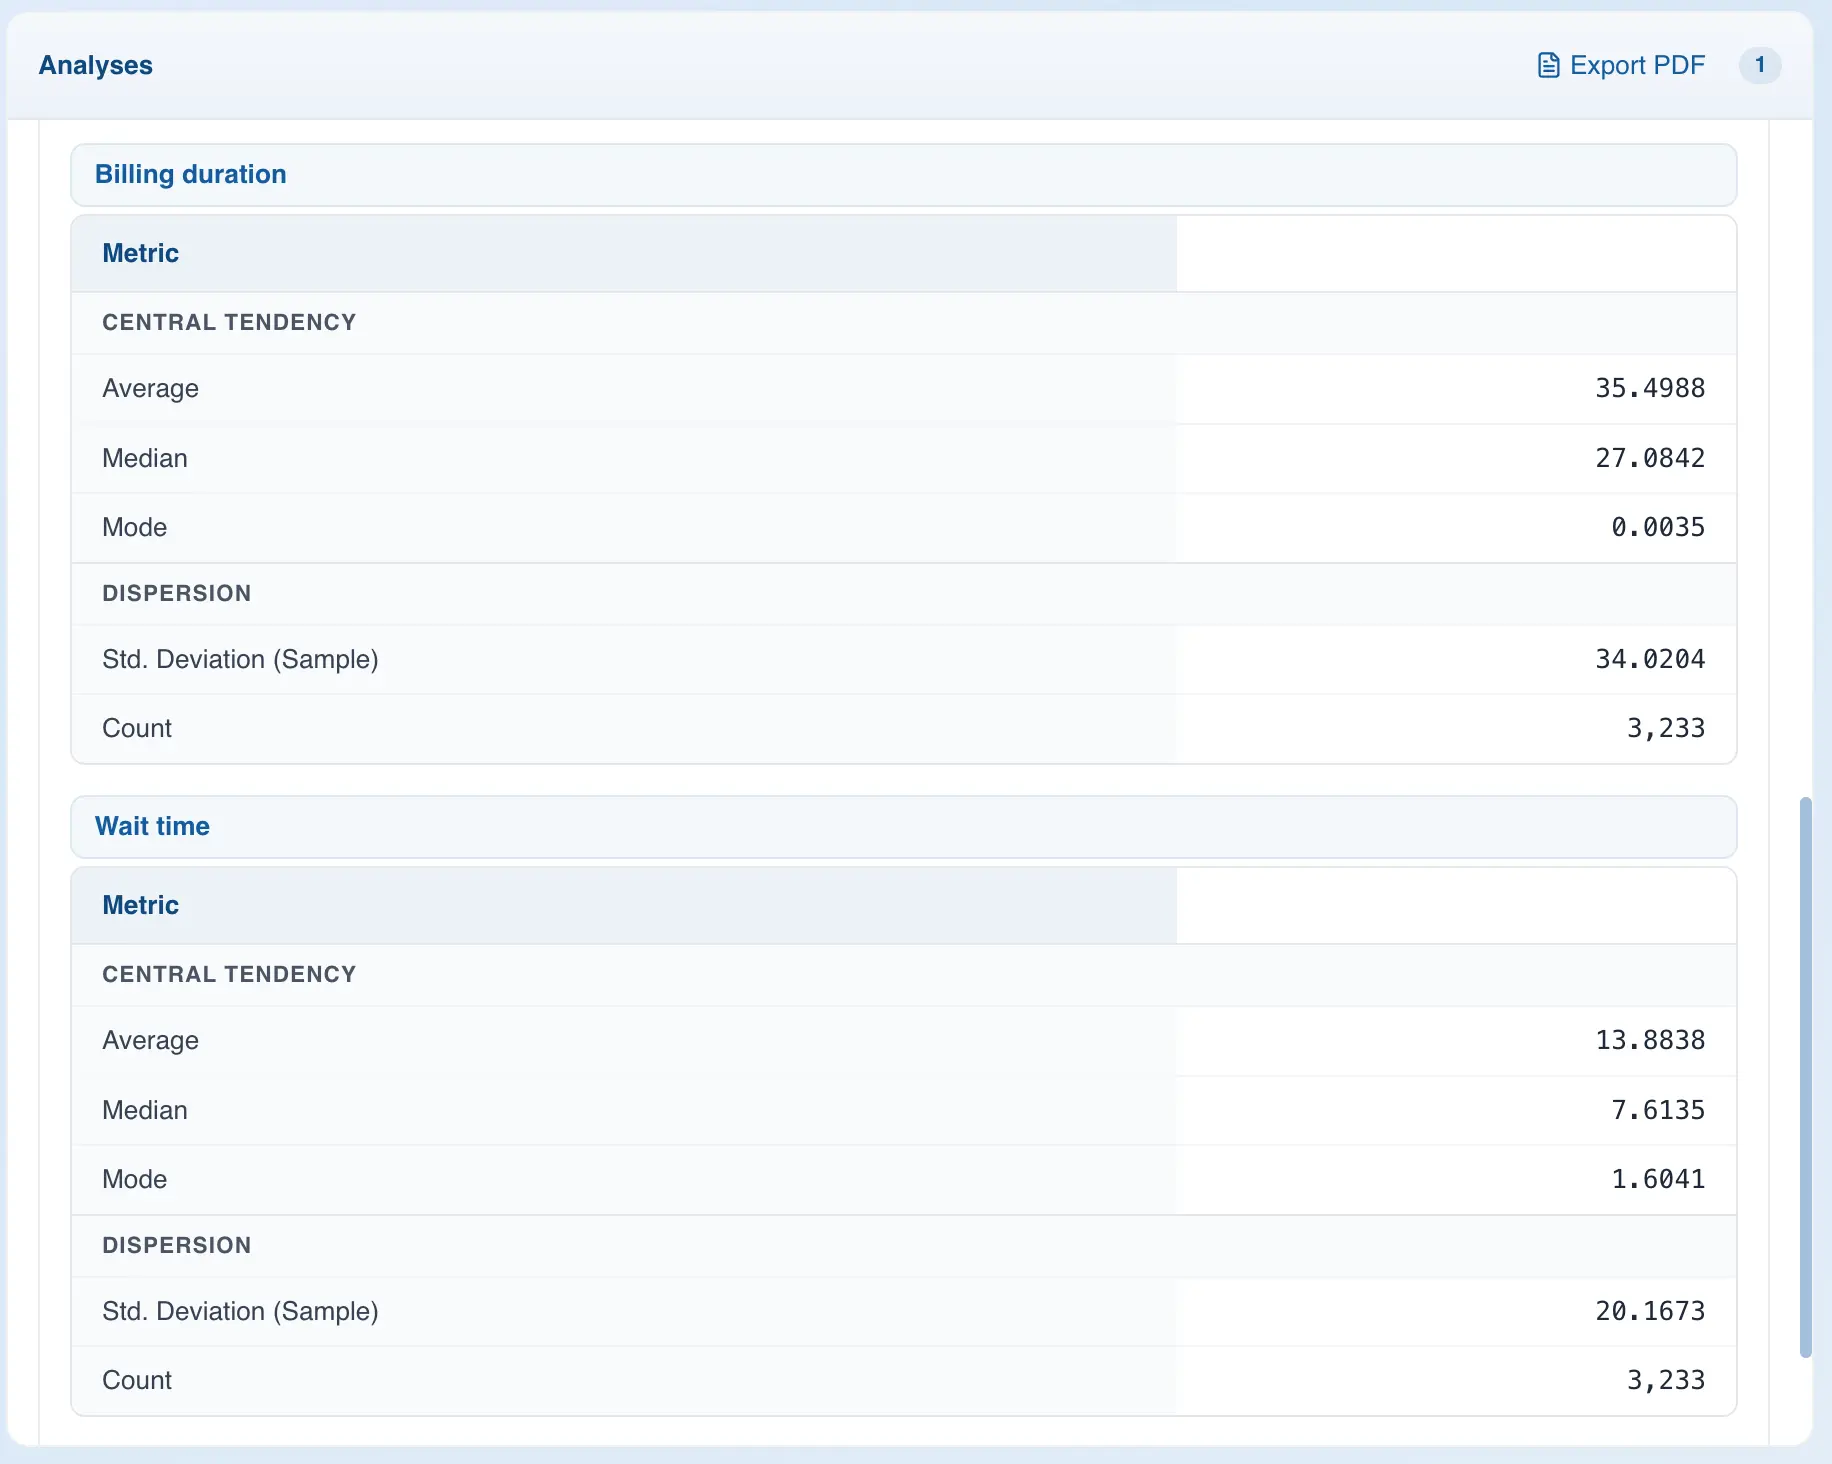
With QSuite you can compute statistical metrics for more than one column at a time. Go to the "Columns" section and drag all the columns you want to analyze to the right-side drop zone.
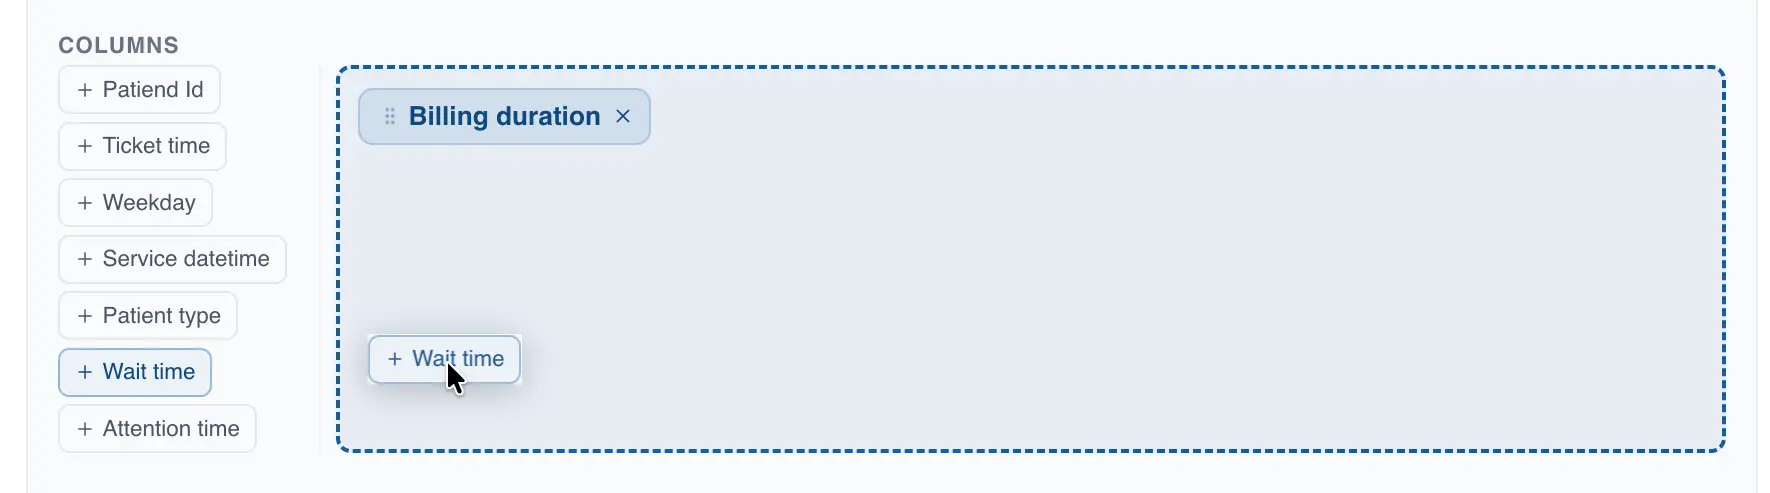
The results for each column will be displayed in a separate table, as shown in the image below.
Viewing the results
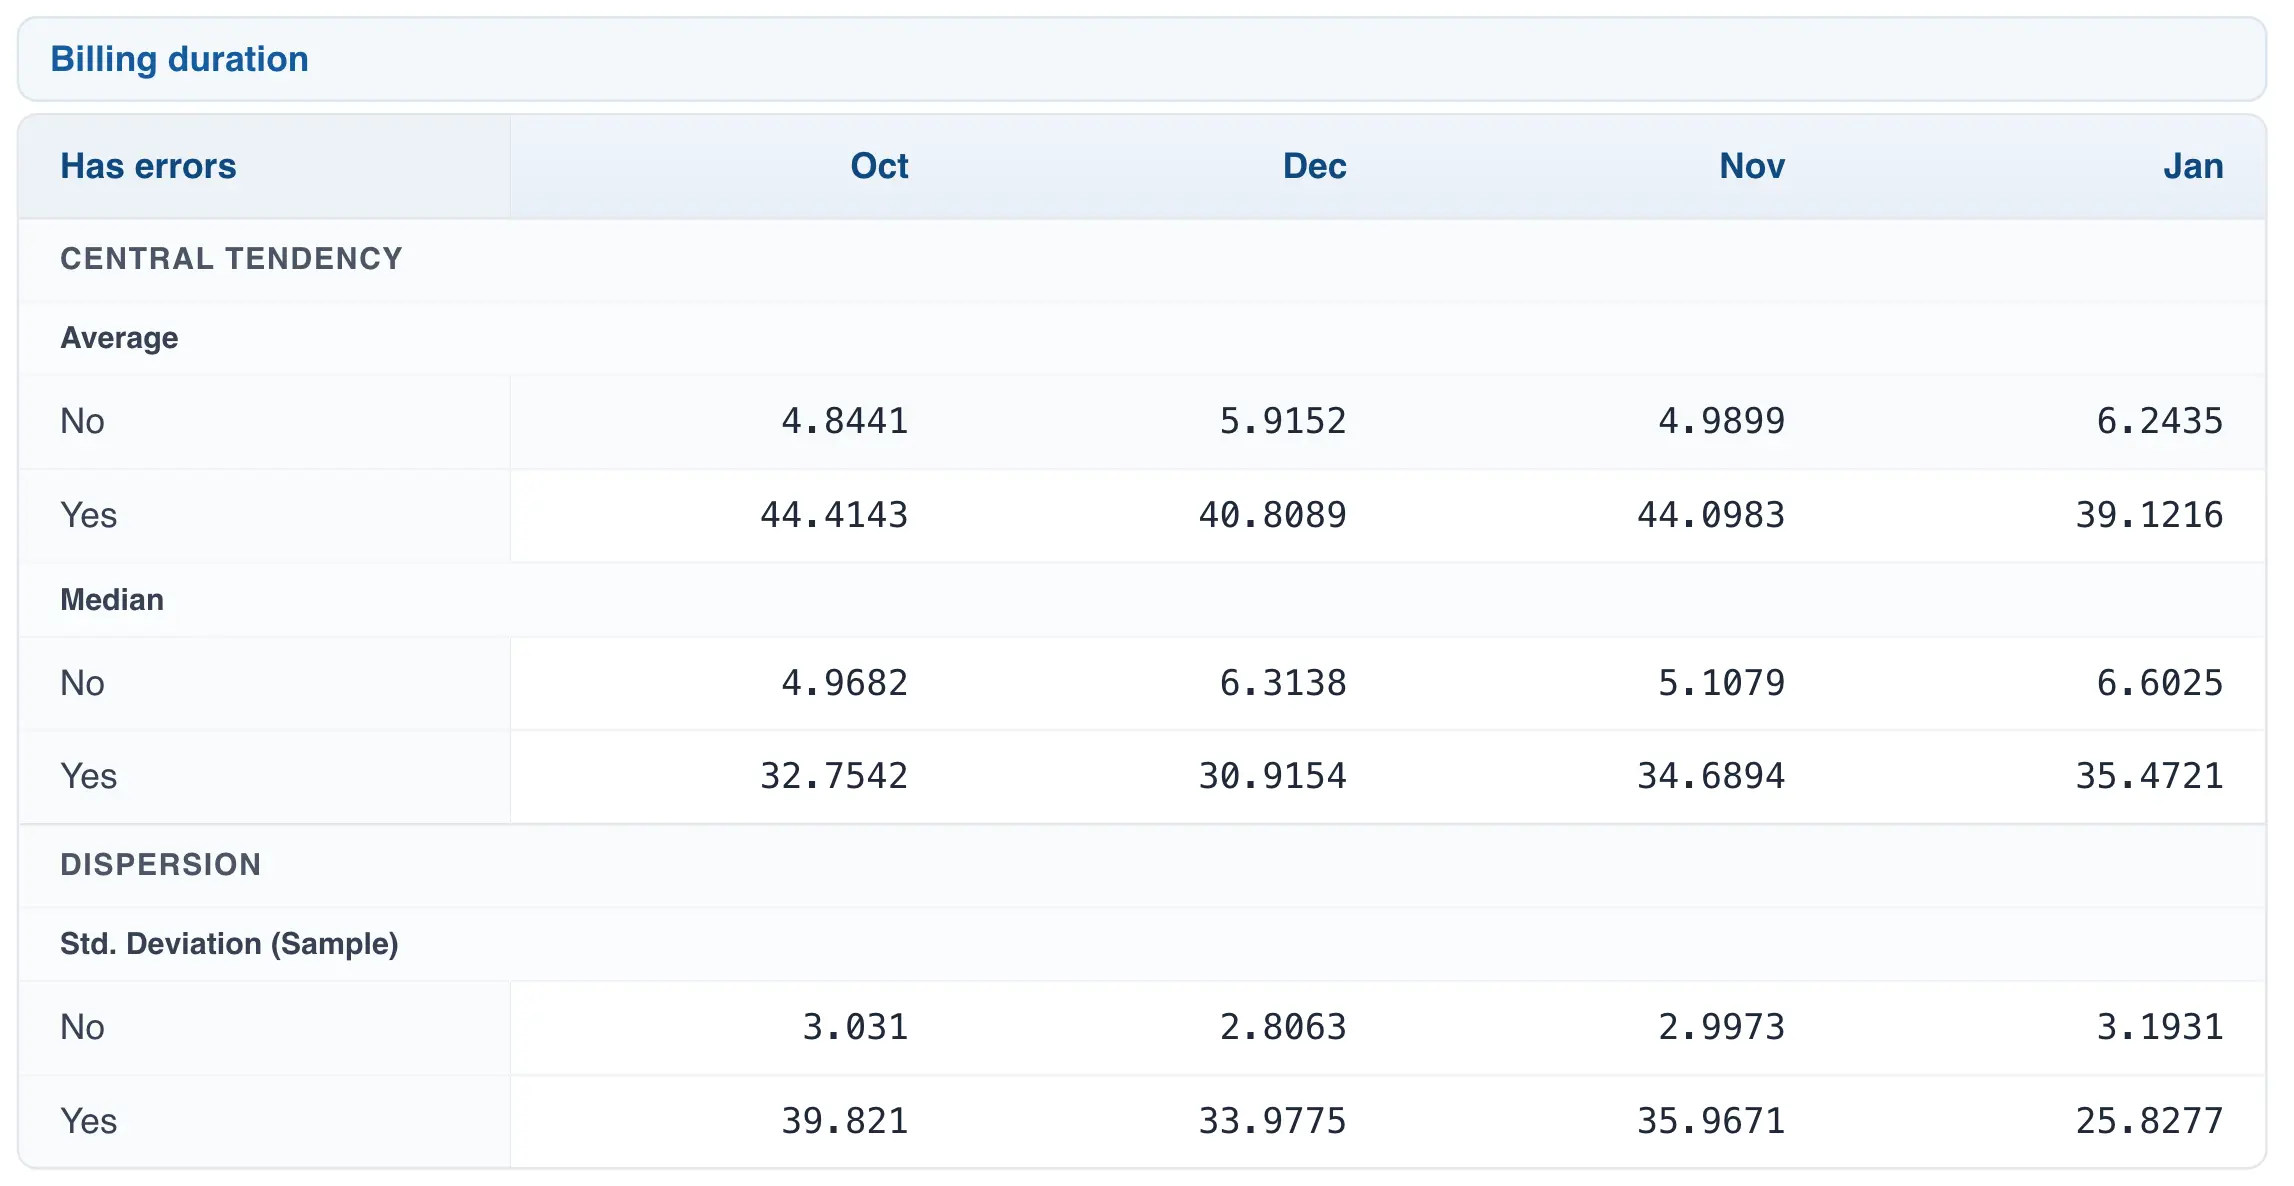
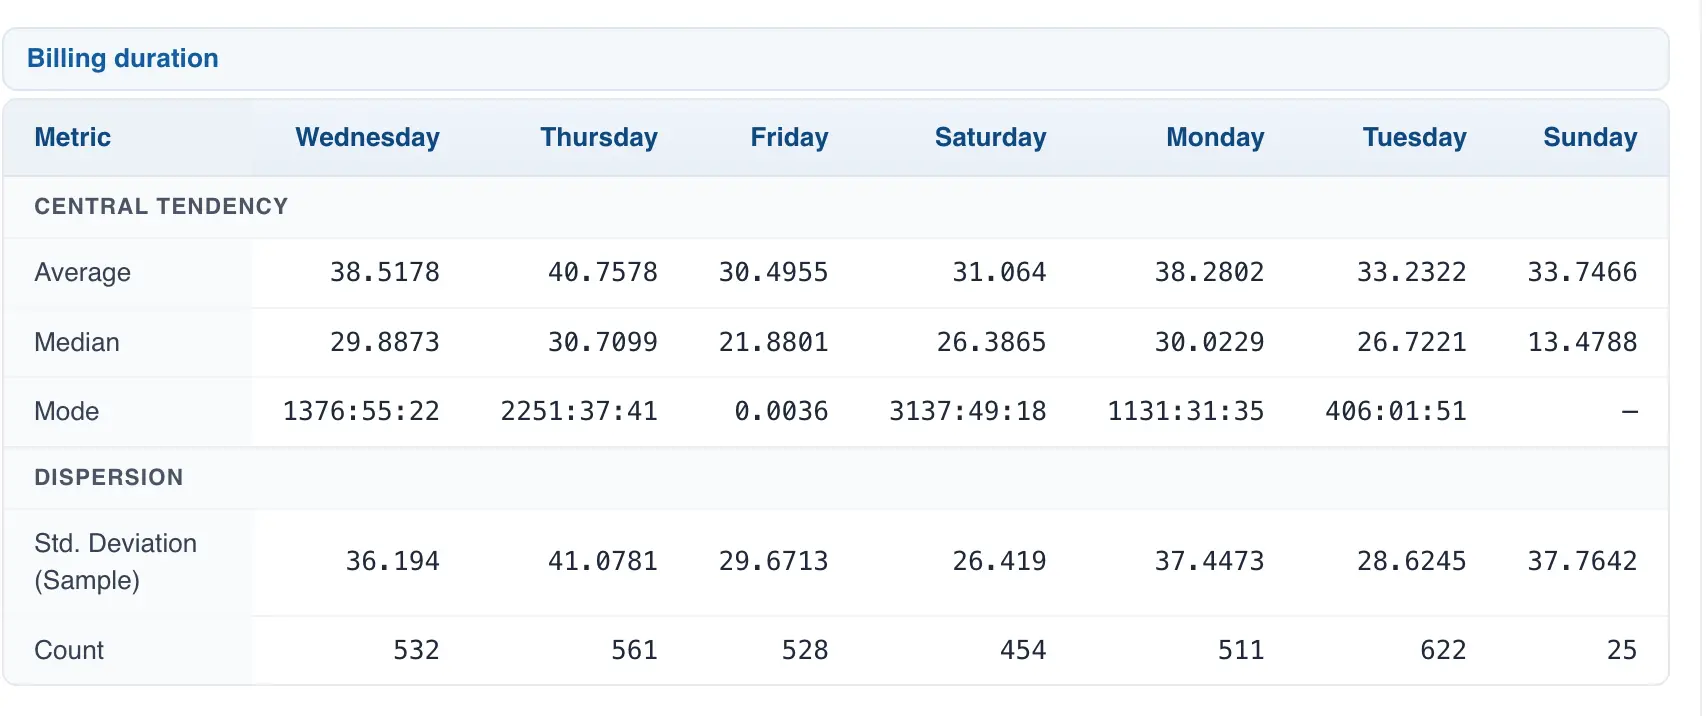
After selecting your metrics, close the configuration area to view your results. If you chose to stratify the data, the results table will show one column per category of the stratification variable.
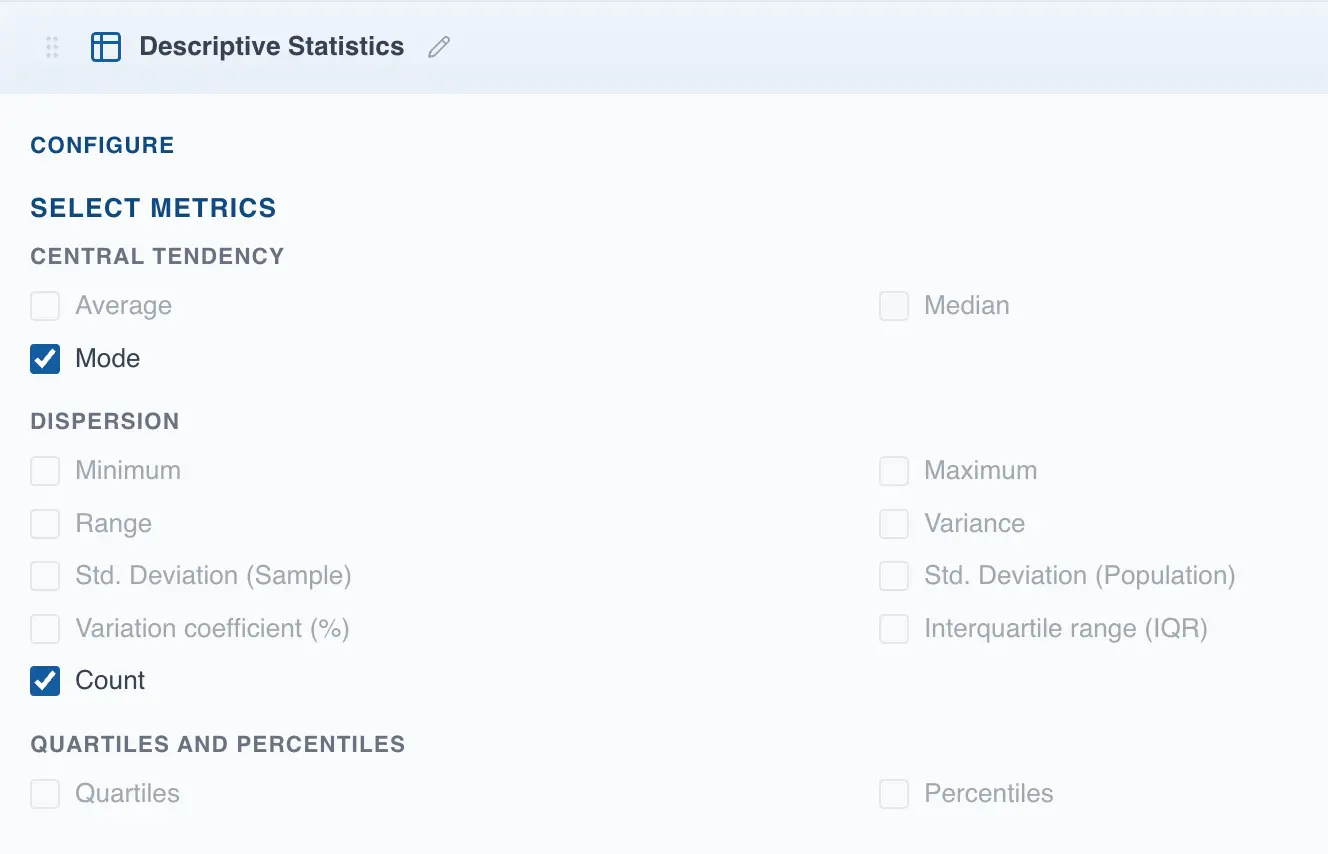
Descriptive analysis of categorical variables
With QSuite you can also create descriptive analyses of categorical data, with some limitations. When you select a column typed as categorical, only three metrics are available: count, mode, and frequency metrics. The remaining metrics will appear disabled.